Creating a profit and loss statement template for a manufacturing business can seem daunting at the outset, but really it is a function of understanding manufacturing cost accounting. We have produced this series of four sessions, (see links to other three below) to provide the basics you need to generate insightful manufacturing profitability analysis. This primer on creating your Profit & Loss Statement pulls together what was discussed in earlier. If you need to better understand how to create your own Direct Labor Rates, Earned Hours and Direct Headcount Plan and/or compute Overhead Utilization variances, which will be helpful to fully understand this primer, please see following posts that preceded this culmination on our manufacturing cost accounting skills primer:
In this fourth and final post in the series, we are going to pull all the different facets required to generate a Profit & Loss statement template for a fictitious manufacturing company, including the revenue plan, cost of goods plan, and the typical manufacturing variances–scrap, overhead absorption, direct labor efficiency variance, etc. With this basic knowledge, you will be able to assemble a fairly detailed profit and loss plan that can be used to provide deep insight into accounting for a manufacturing business focused on performance and necessary corrective actions.
Standard costs in most manufacturing environments consist of three components: 1) Direct Labor; 2) Direct Material; and 3) Overhead. Depending on the manufacturing processes required to produce a finished good or subassembly, there may be other cost components, such as outside processing costs. In our example, we will only focus on the three costs above (Direct Labor, Direct Material and Overhead) for this exercise.
Again, for our fictitious company we have assumed that our standard costs will not include the cost of scrap and yield or in cost accounting lingo be “unyielded standards.” Standard costs can be computed with the cost of scrap and yield “baked” into the standard as well as excluding scrap and yield. “Baking” the cost of scrap and yield into a standard cost is beyond the scope of this post, but will potentially be addressed at a later date if our readers let us know that it would be helpful.
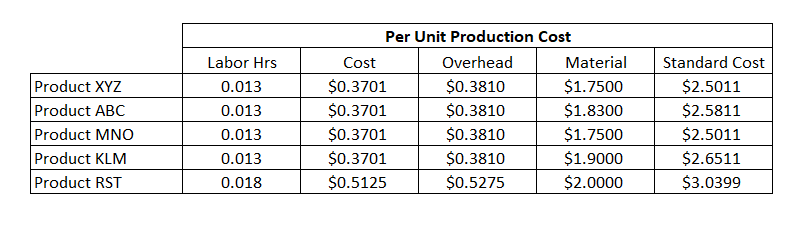
From the chart below, you can see our universe of only five products, the assigned direct labor hours required to produce one unit, the direct labor cost , overhead burden, direct material and the total Standard Cost. If you have a large universe of products, you will want to limit the number of items you use in your plan by selecting a representative part from each subsection of the product hierarchy. Then you want to apply the entire forecast volume for that product hierarchy subsection to the representative part.
In this example, the first four representative parts have a 0.013 hour labor standard, which is then multiplied by the Direct Labor Rate of $18.31 that was computed in post on how to compute a direct labor rate , giving us our $0.3701 unit cost. Next, multiplying the Labor Hours for each product by the hourly overhead rate we developed in how to compute overhead rates and utilize variances we get $0.381 per unit. The final piece is the direct material cost, per unit, which for Product XYZ was $1.7500 to get the total $2.5011 standard cost. We just duplicated the same process to get the other four standard costs.
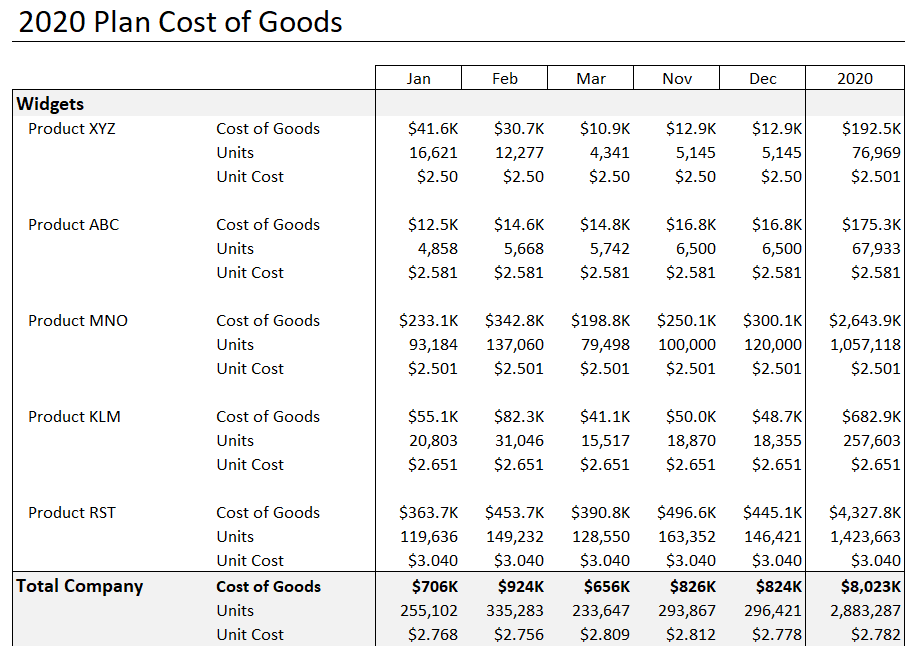
Once we have our unit standard cost, we can extend the unit costs to the shipment volumes to compute the planned cost of goods that is needed to complete a profit and loss statement for a manufacturing business. Looking at the image below for Product XYZ in January, you can see that we were planning to ship 16,621 units. We then multiply this amount by the unit cost of $2.5011 to arrive at the cost of goods for Product XYZ, which is $41.6K. Remember that this cost of goods represents our standard cost excluding any variances for scrap, yield, etc. Accumulating all the different representative part shipment volumes, times each product’s standard cost gives us a total cost of goods for 2020 at $8,028K (see the Total Company section at the bottom of the example below).
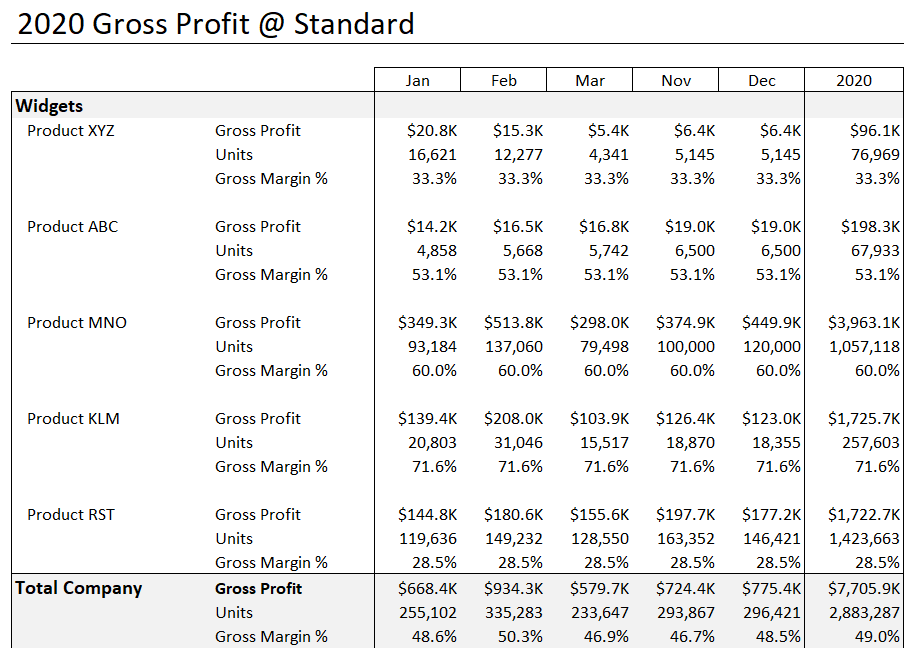
The next step, which is not much of a step, is just creating worksheet that subtracts the cost of goods from the revenue projection for each product as show below. This is titled “Gross Profit @ Standard” given that it just represents the difference between revenue and standard cost, ignoring the effect of variances. So this just represents price minus standard cost. The best way to improve cost at this level is to increase price or Average Sales Prices (ASP). At this point, your sales and marketing teams should be weighing in on whether the 49% gross margin ( and/or gross profit $7,707.9K) is adequate to support a viable business. If Operating Expense combined with interest expense is greater than 50% of revenue, then there is a problem with pricing. Costs may also be an issue, but there is much more leverage with pricing than with cost, to improve margins.
Computing the production variances is a little more complex, but still fairly straightforward. Again, scrap and yield are not “baked” into the standard costs in our example; consequently, we will see the related variance expense (scrap, yield, efficiency and absorption) posted to the profit and loss statement each month in the variance section rather than cost of goods. So on a monthly basis, comparing actual variances to planned variances will provide very meaningful insight into how your operation is operating vs. your plan and goals. The Variance Plan, which totals $2,127K, is as follows:
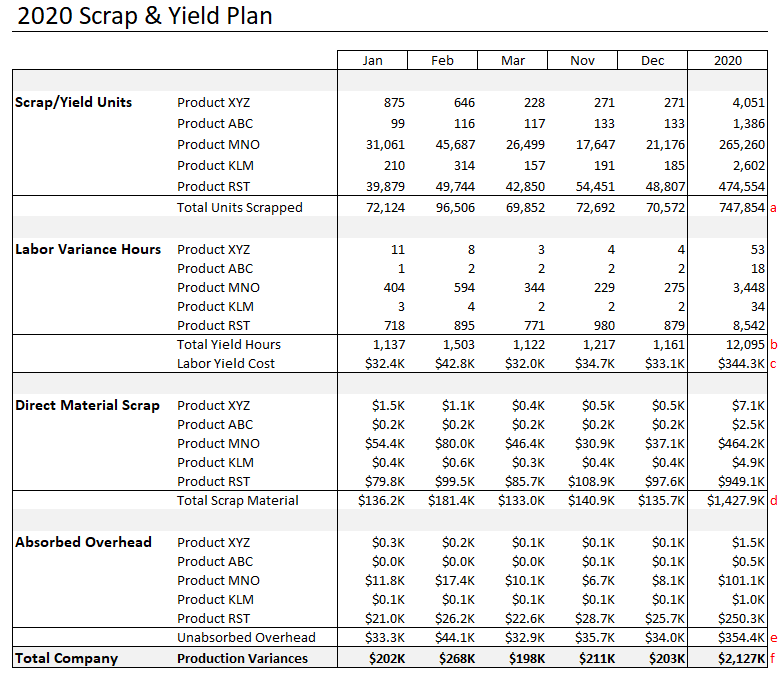
Here is how each category is computed:
At this point, we have computed all the various components of our Profit and Loss plan through cost of goods, which is really the most complicated part of the process. Here is the final result:
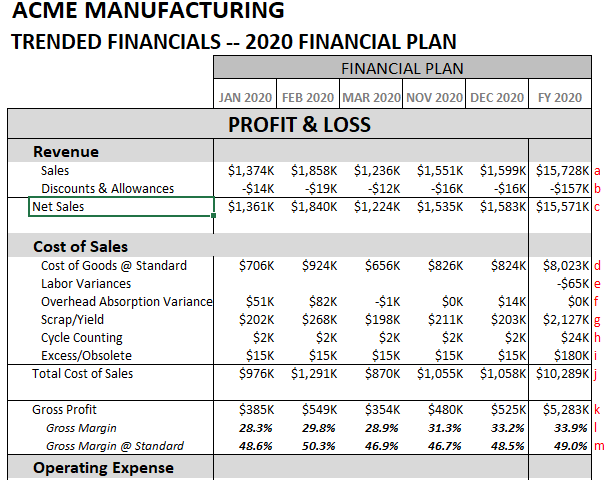
Here is where the source data came from for each row:
That is basically it for all the components of Gross Profit for a manufacturing business. If you would like to view a discussion on to breakdown Sales and Gross Profit variances into volume, price, cost and mix, see our post titled How To Generate Effective Gross Margin Analysis where we describe the various calculations needed to parse a plan vs. actual gross profit variance.
Once you have assembled your Profit and Loss plan, it is a good idea to reconcile all your manufacturing costs–Direct Labor, Contract Labor, Direct Material and Overhead–against your Profit and Loss Statement to validate that you have capture all the expenses. Here is an example:
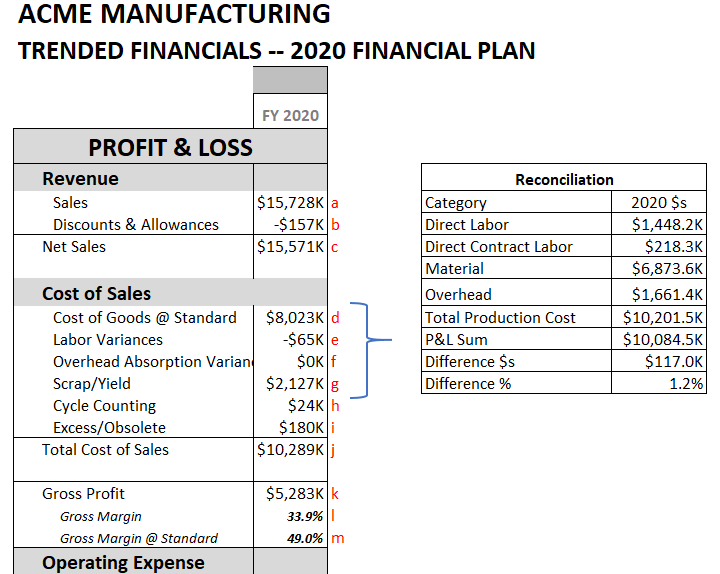
You can see from the above reconciliation that we are comparing the total cost of goods to a simple summation our our Total Product Costs. There was a slight discrepancy, that with additional effort we could eliminate, but for the purposes of this blog post, as we used to say, “it is good enough for government work.”
As we stated at the outset, creating a profit and loss statement plan for a manufacturing company can be daunting. But following our roadmap above, you it will be much more straightforward.
We hope fully you found this enlightening and can utilize it in your own organizations. If you need help setting up your cost accounting processes, please give us call. If you would like a copy of any of the workbooks used as examples, feel free to reach out. We have the tools to help you overcome the financial management obstacles that can inhibit growth.
Chase Morrison provides CFO services, utilizing Profitwyse’s 3D Growth Platform™, enabling his business owner clients to more readily achieve their goals for wealth creation and family legacy. Contact him today to learn how your business can hit the accelerator using Profitwyse’s proven platform.